This page:
- Chart Tags
- ProServe and JSP Scriptlets
- ProServe In a Servlet
- KavaChart PHP
- KavaChart JavaScript
- Chart Wizard
- KavaChart Sampler
Helpful Links:
KavaChart in Action - Examples and Documentation - ProServe
Welcome to KavaChart ProServe!
KavaChart ProServe includes all the tools you need to add dynamic charts and graphs to your server-based software applications. These pages provide example code, tutorials, and documentation to help you get started using KavaChart in your own software.
The samples are organized into 3 sections that reflect the way KavaChart ProServe is usually used:
It's worth browsing through all the samples before deciding which technique is best for your application. You can also browse KavaChart ProServe HTML documentation from these pages, or download the KavaChart ProServe User's Guide in PDF format. The PDF documentation can be printed for a handy desktop reference.
You can also use the KavaChart Chart Wizard to prototype you chart designs without becoming familiar with KavaChart's style properties.
KavaChart ProServe In a Servlet |
|
You can also use KavaChart ProServe objects to build your own servlets. This approach lets you build your own "black box" chart generator that will generate a chart from within any page. For this demonstration, we mapped our own "ChartServlet" class to the name "KavaChart", so we can generate a chart by just opening the URL "KavaChart", like this. By adding additional parameters to the URL, we can make a more complex chart. |
While this approach offers some advantages, it also has some significant disadvantages: servlets generally have a single content-type, which means you won't be able to use KavaChart's drilldown hyperlinks and tooltips. Servlets created this way are also inherently less flexible than tag and scriptlet approaches, although that rigid approach can sometimes be advantageous. For example, if you want to add chart images to tooltip labels, the chart servlet can be a very effective tool. If you want to combine the data management and image streaming advantages of a servlet with the flexibility and drilldown features of a scriptlet, the ProServe Chart Tag collection is probably the best approach. |
KavaChart Sampler |
|
|
|
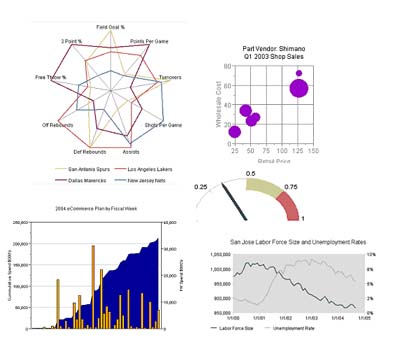
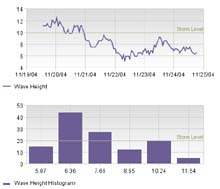
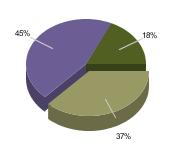
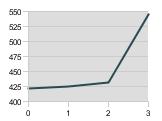
The samples demonstrated on these pages cover the most popular chart types and the most common usage techniques, but KavaChart ProServe includes an extensive library of chart types you can use to build your applications. Some of the more uncommon chart types include bubble charts, gantt charts, twin axis charts, and various financial charts. Since KavaChart can produce an almost limitless variety of chart types, we've organized these samples into 4 collections:
All these charts are used the same way as other ProServe chart types, but some have specialized properties or data requirements. When deciding which chart is most appropriate for your application, please don't hesitate to contact us. In addition to our many years of experience creating data-driven graphics software, we have a staff of design professionals available to make recommendations on the best visual approaches to communicating your data. |