

Chart Services |
|
|
Need that special "one off" chart or a set of special purpose chart types unique to your vertical market. Research; are you looking for a graphical method to present your findings. Mobile devices; are you finding charts and other visualization methods "optimized" for use on mobile devices, not so optimized. You aren't the only one, and more importantly, you'kavachart.come to the right place. KavaChart charting products are extremely versatle, extensible, and frankly, handle the backend data handling, caching, imaging and overall performance issues like no other charting product on the market. What that means is any "special" or custom chart we develop fits into with the KavaChart framework and inherits all of the attributes and properties of any standard out-of-the box chart. No fragile, orphan custom charts here. |
Generally speaking, our Chart Services focus on developing specialized vertical market charts (domain-specific charts) or customizing one of our "out-of-the-box" charts to meet your requirements. For these types of short duration projects, KavaChart Services provides you with a cost effective method to outsource your chart develpment or temporily back up a busy development staff. In the vast majority of cases we can develop a specialized chart type(s) or customize a standard chart(s) for less than $500. Tell us what you need, include an example or sketch, if you have one, and we'll get back to you with a quote. Contact Charting Services. |
Application Services |
|
|
In addition to the short-term chart specific projects, we work with customers on broader application development where data visualization is a central component. Our developers have decades of experience in data visualization, user interaction and project management. |
Tell us about your application. We look forward to learning more about your data visualization requirements. Contact Application Services. Below you'll find a few examples typical of the work done by our Application Services group. |
|
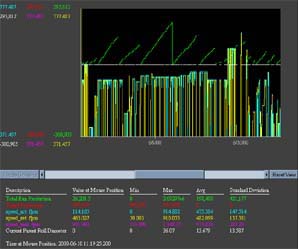
This applet is used in a shopfloor monitoring application to scan through large amounts of data produced by various production equipment. The data for this application is in XML format, and is at a density (over 700,000 points) that requires data reduction for effective overview visualization. Other interesting requirements include the ability to zoom and scroll through the data window with adequate performance, and a live mouse data display that describes 6 variables in differing ranges at the mouse location. In addition, this applet includes a toggle that determines whether labels will use Daylight Savings Time labels or not. Click on the image to see the applet in action. NOTE: sample data is over 1.4 Mb, so please be patient |
|
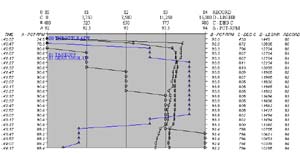
The next chart is used for test flight data recording, and uses numerous X and Y axes. In addition, the chart is rotated 90 degrees so that plot lines run vertically, rather than horzontally. Like the chart above, this graph also uses multiple axis and data ranges. Click on the image to see the applet working. |