
KavaChart in Action - Examples and Documentation - ProServe
[ Back ] Specialty Chart Collection - Gantt Charts
|
Gantt charts are a specialized graphic that helps to schedule resources. It shows
the start and end times for processes or tasks to help you visualize how to optimize
your resource use.
KavaChart ProServe's specialty chart collection includes "ganttApp" for drawing Gantt Charts. This object, "ganttApp" uses special properties "dataset0startDates" and "dataset0EndDates" to describe the start and end times for each track. The dataset name is used to label the track. Up to 40 datasets are available, so that's how many tracks you can have. Each dataset can have as many items as you need. |
|
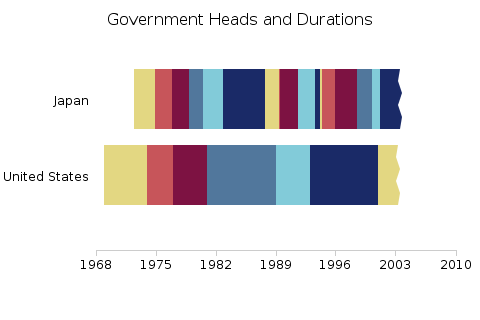
Our first example isn't actually a project, but a visual description of governments in the United States and Japan. US governments form one dataset, and start and end values of each presidential administration are used for "dataset0startDates" and "dataset0EndDates". Dwell labels are used to provide the president or prime minister's name and the start and end of their respective administrations. Note that a "x" is used instead of a real date for the last item in each dataset's "EndDates". The chart interprets this date as an indefinite project end. |
|
|
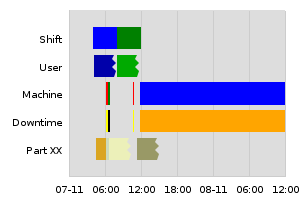
This gantt chart shows scheduling for various resources in a production line. In your charts, you'll probably use some dynamic mechanism, such as JSP or ASP to populate the applet parameters. Like the previous example, we've used an "x" for indefinite dates, and because the param "useTearEdge" is set to "true", these dates appear as a broken or torn end. You can also use the param "customDatasetHandler" to read your data from a file or URL. This param expects to retrieve a stream of rows of characters. Items in the rows are separated by commas. The first item is the task name (dataset name), and subsequent items are start and end dates, in the format defined by the param "inputDateFormat". |
|