

Visual:Acuity - Dashboard Solutions
|
What is a dashboard? The fact is, there's a fair amount of confusion about how to define a dashboard. We think Stephen Few, author of Show Me the Numbers and Information Dashboard Design, has it just about right; "A dashboard is a visual display of the most important information needed to achieve one or more objectives, consolidated and arranged on a single screen so the information can be monitored at a glance." The Problem. Dashboards today fall woefully short of delivering on their promise of more informed and proactive managers. Why? Their design is fundamentally flawed. Dials, gauges, traffic lights, and various info sensors, many designed with a photo-realistic appearance, are examples of a dashboard metaphor pushed beyond its usefulness. Unfortunately, most visual components used in dashboards conspire to obscure and detract from the very information they intend to communicate. We could have selected examples from any number of vendors - the similarities are striking. Visually rich but information poor. The design characteristics of these and most other dashboards result in solutions that are, at best, sub-optimal and in general do a poor job of consolidating, displaying and comparing information, on a single screen. 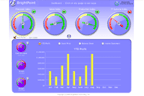
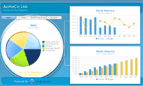
Dashboard examples from Crystal Xcelsius |
The Solution, Visual:Acuity We developed Visual:Acuity out of our frustration using existing dashboard products. We found ourselves asking time and again, why can't we just get the information we need, all in one place. Dials, gauges and many chart types provide very little information for the amount of valuable real estate they use. Poor design and layout make comparisons difficult if not impossible. Spending so much time shuffling through one chart after another to glean vital information made us wonder why anyone would bother - there had to be a better way. The ability to assimilate and make judgments about information quickly and efficiently is key to the definition of a dashboard. Dashboards aren't intended for detailed analysis, or even great precision, but rather summary information, abbreviated in form and content, enough to highlight exceptions and initiate action. In practice this means displaying a lot of information in a small space. A tall order, relying on certain design principles that aren't easily reduced to a plug-n-play solution. Visual:Acuity meets this challenge with a unique combination of software, optimized for dashboard development, and expert design services. What distinguishes a Visual:Acuity dashboard? Use of small display widgets, optimized for dashboards.
Extensive use of time-series information for a "comparative sense" of current values.
Information organized to display related measures at-a-glance.
Only the most critical information needed to measure results.
Navigation methods, such as "drill-down" to expose more detailed information.
|