KavaChart's Custom Tag Library will let you quickly and easily generate all sorts of charts based on your data sources. These tags provide a framework that simplifies page design and maintenance, while automatically optimizing the process of generating data driven graphics.
After the initial setup, the steps described below can generally be performed in any order.
KavaChart's Tag Library is described by the file kavachart-taglib.tld. This file contains an XML description of the various chart tags and inner tags, including a description of what tag attributes are available, required, and available for runtime evaluation.
Place this file in an appropriate location in your application directory hierarchy, such as WEB-INF/kavachart-taglib.tld.
Web.xml is an XML description of the items required by KavaCharts Tag Library. In particular, this file includes a Servlet definition for the "ChartStream" servlet. This servlet acts as a helper class for the "streamed" chart tag. Web.xml also includes a "taglib" definition that tells your server about the location of "kavachart-taglib.tld".
The taglib definition includes a URI definition that will be used in the include statement in your JSP to associate a tag name to the KavaChart tags.
KavaChart's classes are contained in a jar file named "kcServlet.jar". Place this file in your "WEB-INF/lib" directory, or another location that will cause kcServlet.jar to become part of your application's CLASSPATH.
Chart styles are stored in properties files. The chart tag reads these properties on startup, and then (by default) stores them in memory for subsequent chart generation requests.
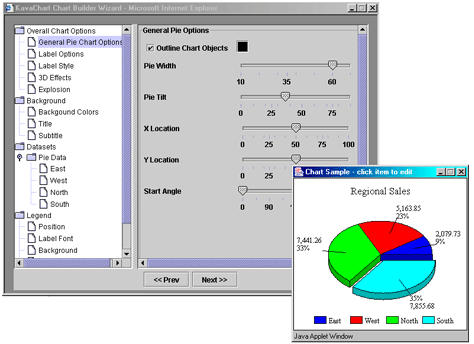
KavaChart's ChartWizard generates chart properties for all of KavaChart's chart types. These properties are generally also applicable to custom charts.

The ChartWizard starts with a specific chart type and a pixel size for your target image, and lets you interactively edit your chart style. There are a variety of options in the wizard for simulating your data sources. Since your data sources will most likely provide live data, data definitions are not created as a part of the wizard's output.
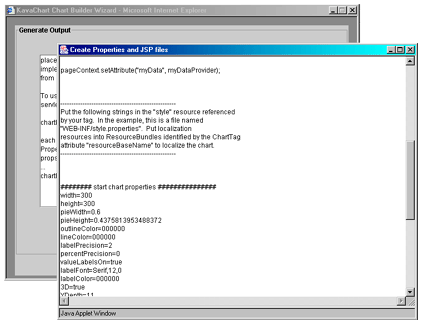
After you have edited your chart style and stepped through the wizard's questions about your output targets, you'll end up with a complete chart tag and property sheet to integrate into your JSP.

Copy and paste the properties section of this output into a properties file. Copy and paste the tag definition into your JSP. Make sure you add the "include" statement, as described in the "Edit Your JSP" section of this document. If necessary, these definitions can be edited later with any sort of text editor.
Note that even though this style was created for a particular chart type, you can change the chart type as a part of your chart tag. You might start out with a stacked column chart, for example, and later decide that side-by-side columns better represent your information.
All that's left is to create a DataProvider that links your chart generation tags to a live data source.
A DataProvider is an implementation of the KavaChart Interface "javachart.applet.DataProvider". By implementing this simple interface in your existing data sources, you can easily translate text and numeric information into graphics.
The Interface:
public Interface javachart.applet.DataProvider {
	/*
	 ** Returns an Enumeration of Dataset classes.
	 */
	public Enumeration getDatasets();
	/*
	 ** Returns a String that uniquely identifies this data.
	 ** Needed to make chart image caching work properly.  Otherwise unnecessary.
	 */
	public String getUniqueIdentifier();
}
You probably already have some kind of data connection that provides you with data for a table, some summary figures, etc. It's a good idea to use the same connection to implement DataProvider so you don't have to make multiple database connections, or use up otherwise scarce server resources. You might want to implement DataProvider with your existing DataSource class.
Here's one example, based on an pre-existing database connection:
Vector chartDataVector;
String query = "SELECT SUM(REVENUES) FROM WIDGETS WHERE QUARTER='Q1'";

public void getSomeData(){

	//-------- a bunch of database connection setup stuff deleted here...
	statement = connection.createStatement();
	myresult = statement.executeQuery(query);
	while (myresult.next()){ //retrieve next row
		int i=0;
		//you're going to be doing something else interesting with the data here...
		series0yValues.addElement(myresult.getString(i++));
		series0Labels.addElement(myresult.getString(i++));
	}

	//create some KavaChart data - this is one way to do it...
	//first series
	double yVals[] = new double[series0Values.size()];
	String labels[] = new String[series0Labels.size()];
	for(int i=0;i<yVals.length;i++){
		yVals[i] = Double.valueOf(series0Values.elementAt(i)).doubleValue();
		labels[i] = (String)series0Labels.elementAt(i);
	}

	//one possible Dataset constructor
	//alternatives are listed here
	Dataset set1 = new Dataset("series 1", yVals, labels, 1, null);

	//put them into our Vector, declared as a Class variable:
	chartDataVector = new Vector();
	chartDataVector.addElement(set1);
}

//and finally the DataProvider implementation:
public Enumeration getDatasets(){
	return chartDataVector.elements();
}

//a unique identifier to prevent chart collisions in a multi-threaded environment
public String getUniqueIdentifier(){
	return query; //not unique here, but it will be in your class
}
This code segment creates a KavaChart Dataset class, and then puts it into a Vector. It returns that Vector's elements, along with the query string. The query string is simply used as a unique identifier in the event that multiple threads are requesting charts at the same time. It won't appear anywhere in the HTML or image data generated by the chart tag.
As you can see, implementing the Interface consists of creating 1 or more Dataset classes and placing these into a Vector or other Enumeration. You're free to determine how these classes are constructed, what data to consider in the Dataset, whether labels or X values are relevant, and so on. Numerous Dataset constructors exist. Consult the KavaChart API documentation for more information on constructing Datasets.
The chart tag retrieves the DataProvider from the page, session, or application context. To do this, the DataProvider must be placed into the context at some point during the page generation process.
One way to accomplish this is to create a JavaBean from your DataProvider, and install it as a part of the page definition:
<jsp:useBean id="dataId" scope="page" class="examples.RandomNumberDataProvider" />
This statement, for example, installs RandomNumberDataProvider into the ID "dataId". This class is provided with KavaChart's taglib example classes to provide sample data where no real data exists. It might also be useful in cases where you don't have a real DataProvider ready, but the page designer wants to proceed.
A more likely methodology involves installing the DataProvider with a small scriptlet, or as another part of your overall page generation code. For example, let's say we have a data acquisition class instance "myDataSource" that implements our DataProvider interface. We might install that class like this:
getPageContext().setAttribute("dataId", myDataSource);
Since we named our DataProvider "dataId", the chart tag would reference it like this:
<chart:streamed
	dataProviderID="dataId"
	style="WEB-INF/myStyle.properties"
	chartType="lineApp" >
</chart:streamed >
When the tag is executed, a KavaChart "lineApp" server bean is created, data from the DataProvider "dataId" (actually the class instance "myDataSource") is applied to the bean, styles from "myStyle.properties" are applied, and the image bytes are streamed back into the page.
Installing your DataProvider in the most appropriate context will ensure the most efficient use of that resource. For example, DataProviders placed into the application context will persist for the lifetime of the application, and can be shared by all users who generate charts. This might be appropriate for shared information, like weather data. Page context resources will be discarded after each page is viewed. This is appropriate for charts that have page-unique information, like a pie chart showing a user's financial portfolio distribution.
Since data management is cleanly separated from the presentation layer, the DataProvider can change dramatically without altering the overall page presentation, and vice-versa.
As we discussed above, KavaChart's ChartWizard will generate a chart tag with the appropriate attributes and properties file for the chart you created there. You can also directly edit and create chart tags and property sheets. Here's how to add a chart tag to your JSP:
Add this line to your JSP:
<%@ taglib uri="http://www.kavachart.com/kavachart-taglib" prefix="chart" %>
This assumes that your web.xml file includes a definition for the kavachart-taglib.tld taglib descriptor, and that the taglib URI in that description matches the uri above. You can use any prefix you like. We'll use "chart" for our examples here.
<chart:streamed
	dataProviderID="myData"
	style="WEB-INF/myStyle.properties"
	chartType="pieApp" >
</chart:streamed >
Chart tags use a form like the example above. Each tag starts with a reference to the taglib you're using ("chart" in our case), and then the particular tag you're using ("streamed" in this example).
Chart tags can use several attributes. The three attributes used in this example are the most important:
When the JSP is compiled into a servlet, this tag is translated into Java code. The tag approach optimizes the chart generation process by caching persistent information like style properties or frequently accessed images. The tags also simplify things like localization, data filtering, and so on.
This particular tag is translated into an image tag that retrieves its image data from a helper servlet. Other tags will represent the chart as an applet, or by creating a cache image on the server.
KavaChart's tags have a variety of useful attributes and variations that might be useful in you application.
The chart tags use conventional Java ResourceBundles to achieve localization. Typically a resource bundle is a set of properties files consisting of property=value statements. The default ResourceBundle must be located within your application's CLASSPATH, and must be named resourceBundleBaseName.properties. Localized resource bundles use the convention resourceBundleBaseName_en.properties, where "en" is replaced by the specific locale ID represented by that bundle. You can localize any property, including fonts, titles, dataset names, even colors. Non-western locales can be supported with ResourceBundle classes rather than text files.
A chart tag attribute lets you specify the ResourceBundle base name.
You can also create ResourceBundle instances during the page creation process and install those resources as an attribute:
getPageContext().setAttribute("resBndl", myResourceBundle);
The chart tag will retrieve this resource bundle and apply it to your charts if you specify the resourceBundleID like this:
<chart:streamed
	dataProviderID="dataId"
	style="WEB-INF/myStyle.properties"
	chartType="lineApp"
	resourceBundleID="resBndl" >
</chart:streamed >
This approach lets you combine your page localization resources together with your chart localization resources.
An inner tag (locale) exists to let you test your chart localization approach without finding a localized client machine.
The chart tags include an inner tag (datafilter) that can filter the data to reduce the number of datasets or observations produced by your DataProvider. This can be used to script user actions that reduce the volume of visible data to focus on pertinent information.
The tag collection also includes tags (datasimulation, timedatasimulation) to simulate incoming data. This lets you proceed with the page design process in the absence of a working DataProvider class.
The tag collection also includes tags for performing arithetic on incoming data, sorting data, combining portions of data for analysis (regressionfeeder), evaluating percentage changes, creating histograms from incoming data, and so on. See the tag reference documentation for more information about these tags.
Chart tags have 4 variants: streamed, cached, table, and applet. The samples we've used so far use the "streamed" approach.
The "cached" tag saves an image on your server's filesystem and returns a reference to that image. This can provide significant optimizations if your application generates images with high reuse. For example, if your users are looking at daily inventory levels, your data will change only once per day. A busy server might benefit by re-using chart images, rather than re-generating the chart image for each user.
Another variant is the "applet" tag. This tag generates an applet definition that will produce your chart image on a client browser. The primary advantage of using applets to generate your chart image is that all imaging activity is distributed to client machines. In the right circumstances, this can save server bandwidth and even enhance page rendering speed. Applets rely on having consistent browser configurations, however, and don't give users the same flexibility to copy and paste images into other applications.
Finally, a "table" tag lets you see the actual data you're charting. This tag combines its output with your own cascading style-sheet classes for presentation.